

Pattern.
Discovery.
Logic.
Supervised models predict outcomes based on known targets. Unsupervised learning operates in the void—detecting latent topographies within raw feature spaces where no ground truth labels exist.
At Oilrise ML Academy, we deconstruct the geometric mechanics of dimensionality and the mathematical convergence of grouping systems. This is the study of data structure prior to interpretation.
Structural Clustering
& Similarity Measures
Clustering is fundamentally an optimization problem: minimizing intra-cluster variance while maximizing inter-cluster separation. We examine the divergence between density-based discovery and centroid-based partitions.

01 Distinct Proximity Metrics
The choice between Euclidean, Manhattan, and Cosine distance determines the final shape of the discovered groups. Euclidean distance assumes spherical clusters, while Manhattan is more robust to architectural outliers in high-dimensional grids.
02 Centroid vs Density
K-Means partitions data into Voronoi cells based on mean distances, requiring pre-defined cluster counts. DBSCAN (Density-Based Spatial Clustering of Applications with Noise) discovers arbitrary shapes by identifying core points in high-density regions, effectively isolating noise.
Clustering Cost Function (WCSS)
The Elbow Method is used to determine the optimal value for k by tracking the inflection point where additional clusters yield diminishing returns in variance reduction.
Analyze Validation
The Curse of
Dimensionality
As the number of features increases, the volume of the space grows exponentially, causing data points to become sparse. This sparsity prevents traditional distance metrics from accurately capturing similarity, leading to computational instability.
PCA: Principal Component Analysis
PCA projects high-dimensional data into a lower-dimensional subspace while preserving maximum variance. This is achieved through eigenvalue decomposition of the covariance matrix, identifying the orthogonal axes of greatest variance.
- ● COVARIANCE_MATRIX = (1/n) * X_T * X
- ● EIGENVECTOR_COMPUTATION (Φλ)
- ● MAGNITUDE_RANKING_BY_EIGENVALUE
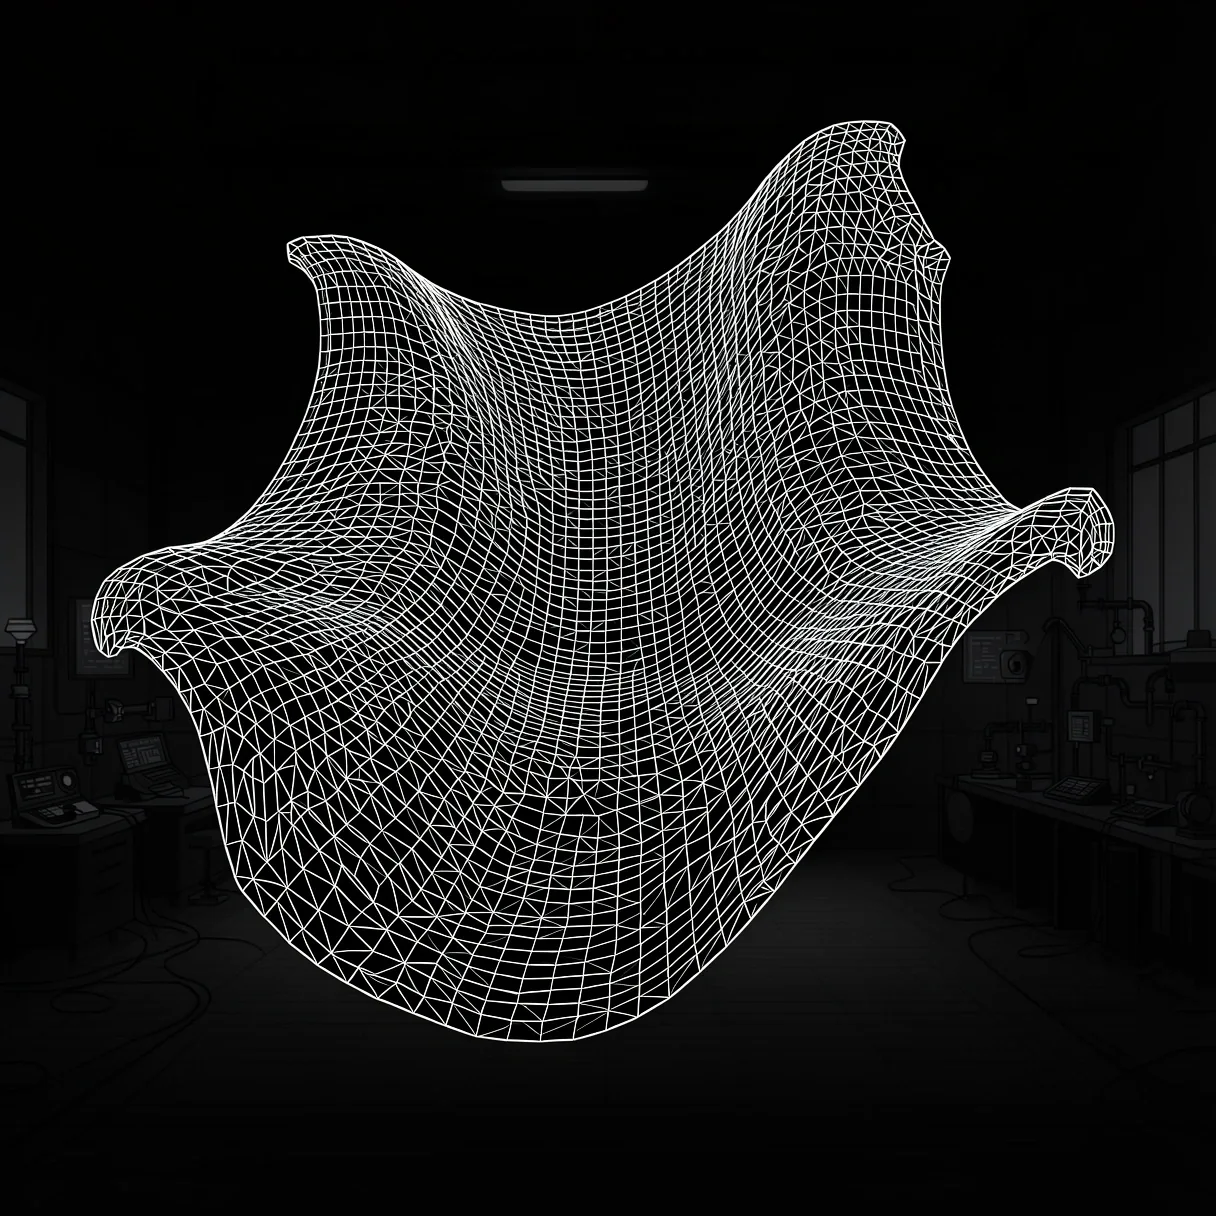
Eigenvalue decomposition reveals the primary signal components, allowing researchers to discard noise-saturated dimensions without losing fundamental pattern integrity.
Transitional Logic
Validation.
Unsupervised patterns provide the structure; evaluation frameworks provide the proof. Transition from pattern discovery to structural validation to confirm consistency and silhouette scores.
Refined PCA Review
A complete derivation of covariance matrix mechanics for high-dimensional feature engineering.
Silhouette Scoring
Measuring cluster cohesion versus separation through internal consistency metrics.
DBSCAN Tuning
Technical parameters for epsilon and minimum neighbors in non-spherical density detection.